
YouTube video analytics tells the story of your video’s performance, showing you exactly what’s working and what’s not. Don’t think of it as a scary report card. Instead, see it as your personal roadmap to creating videos that your audience—and the YouTube algorithm—will absolutely love. By understanding your data, you can refine your YouTube search strategy and create content that truly connects.
Your Guide to YouTube Video Analytics
Welcome to your channel’s command center: YouTube Studio. The numbers can feel a little intimidating at first, but they’re the most powerful tool you have for growing your channel. The secret isn’t to get lost in a sea of data, but to zero in on the metrics that actually move the needle and provide actionable insights.
Getting comfortable with your youtube video analytics is the first real step toward making smarter, more strategic decisions about your content. Instead of just chasing views, we’re going to dive into what those views really mean for your channel’s growth.
Core YouTube Analytics Metrics and What They Mean
To get started, it helps to have a quick reference for what you’re even looking at. This table breaks down the most important metrics you’ll find in YouTube Studio and explains why they’re so critical for your channel’s success.
| Metric | What It Measures | Why It Matters for Growth |
|---|---|---|
| Impressions | How many times your video’s thumbnail was shown to viewers on YouTube. | This is your reach. High impressions mean the algorithm is testing your video with a broad audience. |
| Click-Through Rate (CTR) | The percentage of people who saw your thumbnail (an impression) and clicked to watch. | This is your first impression. A strong CTR tells YouTube your title and thumbnail are compelling and effective. |
| Views | The number of times your video has been watched. | While important, views are the result of good impressions and CTR, not the starting point. |
| Average View Duration | The average length of time viewers watch your video. | This is a key engagement signal. Longer watch times tell YouTube that your content is valuable and delivering on its promise. |
| Audience Retention | A graph showing what percentage of your audience is still watching at any given point in the video. | This shows you exactly where people get bored and click away. It’s gold for improving future videos. |
Think of these metrics as interconnected pieces of a puzzle. A great thumbnail improves your CTR, which leads to more views, and great content increases your average view duration. All of these signals work together to tell YouTube to promote your video even more.
The Metrics That Truly Matter
When it comes down to it, real channel growth is a dance between three key areas of your youtube video analytics:
- Reach: How many people are seeing your video’s thumbnail and title? This is all about Impressions.
- Engagement: Of the people who see it, how many actually click? That’s your Click-Through Rate (CTR).
- Audience Retention: After they click, how long do they stick around? This might just be the most important metric of them all.
These three elements are totally interconnected. They create a powerful feedback loop. A killer thumbnail and title boost your CTR, which signals to the YouTube algorithm that you’ve got something interesting. When those viewers then watch for a good chunk of time, it proves the click was worth it, encouraging the algorithm to push your video to even more people. That’s how your reach explodes.
Thought-Provoking Strategy: Your goal isn’t just to get views, but to earn quality views. A video with a million views but a 30-second watch time tells YouTube it was clickbait. A video with high retention, however, signals a genuinely satisfying experience for the viewer, which is far more valuable for long-term growth.
For a deeper look into a holistic approach, check out our guide on growing a YouTube channel. By mastering these fundamentals, you stop passively looking at reports and start actively building a strategy that creates content people truly want to watch.
Discover Who Your Audience Really Is

Making great content is only half the job. The other half—the part that truly grows a channel—is knowing exactly who you’re making it for.
This is where the ‘Audience’ tab in your youtube video analytics becomes your best friend. Forget guesswork. This is your direct line to understanding the people who click play, and it’s packed with actionable insights that can completely change your approach.
A lot of creators glance at the basic age and gender stats and move on, but the real magic happens when you look a little closer. Two of the most telling metrics are Unique Viewers and Returning Viewers.
- Unique Viewers: Think of this as your total reach. It’s the raw number of individual people who watched your videos over a certain period. Seeing this number go up means your content is successfully pulling in new faces.
- Returning Viewers: This is where loyalty lives. These are the people who watched something and then came back for more. This metric is a powerful signal to YouTube that you’re not just getting views; you’re building a community.
Reading the Viewer Loyalty Chart
That chart comparing new and returning viewers is more than just a pretty graph. If your purple line (new viewers) is towering over your blue line (returning viewers), it tells a story. You’re fantastic at discovery, but you might need to give people a stronger reason to stick around and subscribe.
A healthy, growing channel will show both lines climbing together over time. This balance is key.
Understanding this dynamic is crucial, especially when you think about monetization. YouTube’s ad reach potential is a staggering 2.53 billion users globally, with a huge chunk of that being adults aged 25 to 34. Knowing if your audience aligns with these high-engagement demographics can make your channel far more attractive to brands. Whether you’re tapping into the massive 491 million user base in India or a high-penetration market, knowing your audience helps you tailor content that resonates. For a deeper dive, check out these YouTube market statistics.
A huge part of sustainable success is turning one-time viewers into loyal fans. Digging into your audience analytics is the first step. You can also explore additional strategies by reading our guide on how to be a successful YouTuber.
Find the Perfect Time to Post
Okay, this next one is one of the most practical tools in the entire Audience tab: the “When your viewers are on YouTube” graph.
It’s a simple purple bar chart, but it’s incredibly powerful. It shows you the exact days and hours your specific audience is most active on YouTube. This isn’t generic advice; it’s a custom-made schedule for your channel.
By publishing your videos right as these peak times kick off, you give your content an immediate advantage. More of your subscribers will see it pop up, which drives those crucial early views and engagement. That initial momentum can be the signal the algorithm needs to start pushing your video out to a wider audience.
To really capitalize on this, make sure your thumbnail is a winner before you hit publish. Testing a few ideas with a tool like Thumb Scout can maximize your click-through rate the moment your audience is most active.
Master the Funnel from Impression to Watch Time
The ‘Reach’ tab inside your YouTube Studio analytics tells a fascinating story. It’s the journey your video takes, starting as a single thumbnail among millions and—if you play your cards right—ending as meaningful watch time. Learning to read this journey, or “funnel,” is a creator superpower.
Let’s unpack this. It all begins with an Impression, which is just YouTube showing your thumbnail to a potential viewer. The next critical step is turning that impression into a click, which is measured by your Click-Through Rate (CTR). Finally, that click needs to become sustained engagement, measured by Watch Time. If you can master each stage, your channel is going to grow. It’s that simple.
Turning Impressions Into Clicks
Your CTR is the first major hurdle you have to clear. Think of it as the percentage of people who saw your thumbnail and actually bothered to click. A low CTR is a huge red flag for the algorithm; it basically tells YouTube that even when your video is shown to people, it isn’t compelling enough to earn their attention.
This is where your title and thumbnail have to do all the heavy lifting. They are your one-two punch to grab a viewer.
- Titles: Your title has to walk a fine line between creating curiosity and providing clarity. It needs to accurately hint at the video’s content while giving someone a powerful reason to want to know more.
- Thumbnails: A great thumbnail connects emotionally and is instantly understandable. It has to pop in a crowded feed, which usually means clear visuals, bold text, and expressive faces (if that fits your content).
Here’s an actionable tip: before you publish, get a data-driven sense of how your thumbnail might perform. You can get an instant AI score with a tool like Thumb Scout to see if your design is actually set up for success. This simple check can make a massive difference in a video’s initial CTR.
Understanding Your Traffic Sources
You need to remember that not all impressions are created equal. Digging into the ‘Traffic Sources’ report within the Reach tab shows you where YouTube is showing your video. This context is absolutely vital for making sense of your CTR.
For example, a 10% CTR from YouTube Search is incredible, because viewers were actively looking for what you made. But a 2% CTR from Browse Features (the home page) is also really strong, since your video is competing against a nearly endless scroll of other options for a viewer’s passive attention.
Analyzing these sources helps you figure out where you’re winning. If you see high impressions from ‘Suggested Videos,’ that’s gold. It means your content is being effectively paired with other popular videos, which is one of the biggest drivers for channel growth. For a complete deep dive on this, you can learn more about what makes a good YouTube click-through rate.
The Ultimate Goal: Watch Time
Earning that click is just the start. The final, and I’d argue most important, piece of the puzzle is Watch Time. Once someone clicks, your video absolutely must deliver on the promise your title and thumbnail made.
High watch time and a solid average view duration are powerful signals to YouTube. They confirm that your video didn’t just attract a viewer, but it also satisfied them. This positive feedback loop encourages the algorithm to push your video out to an even wider audience, creating that amazing cycle of growth we’re all chasing.
This simple workflow gives you a visual for how to use your analytics to improve this key metric.
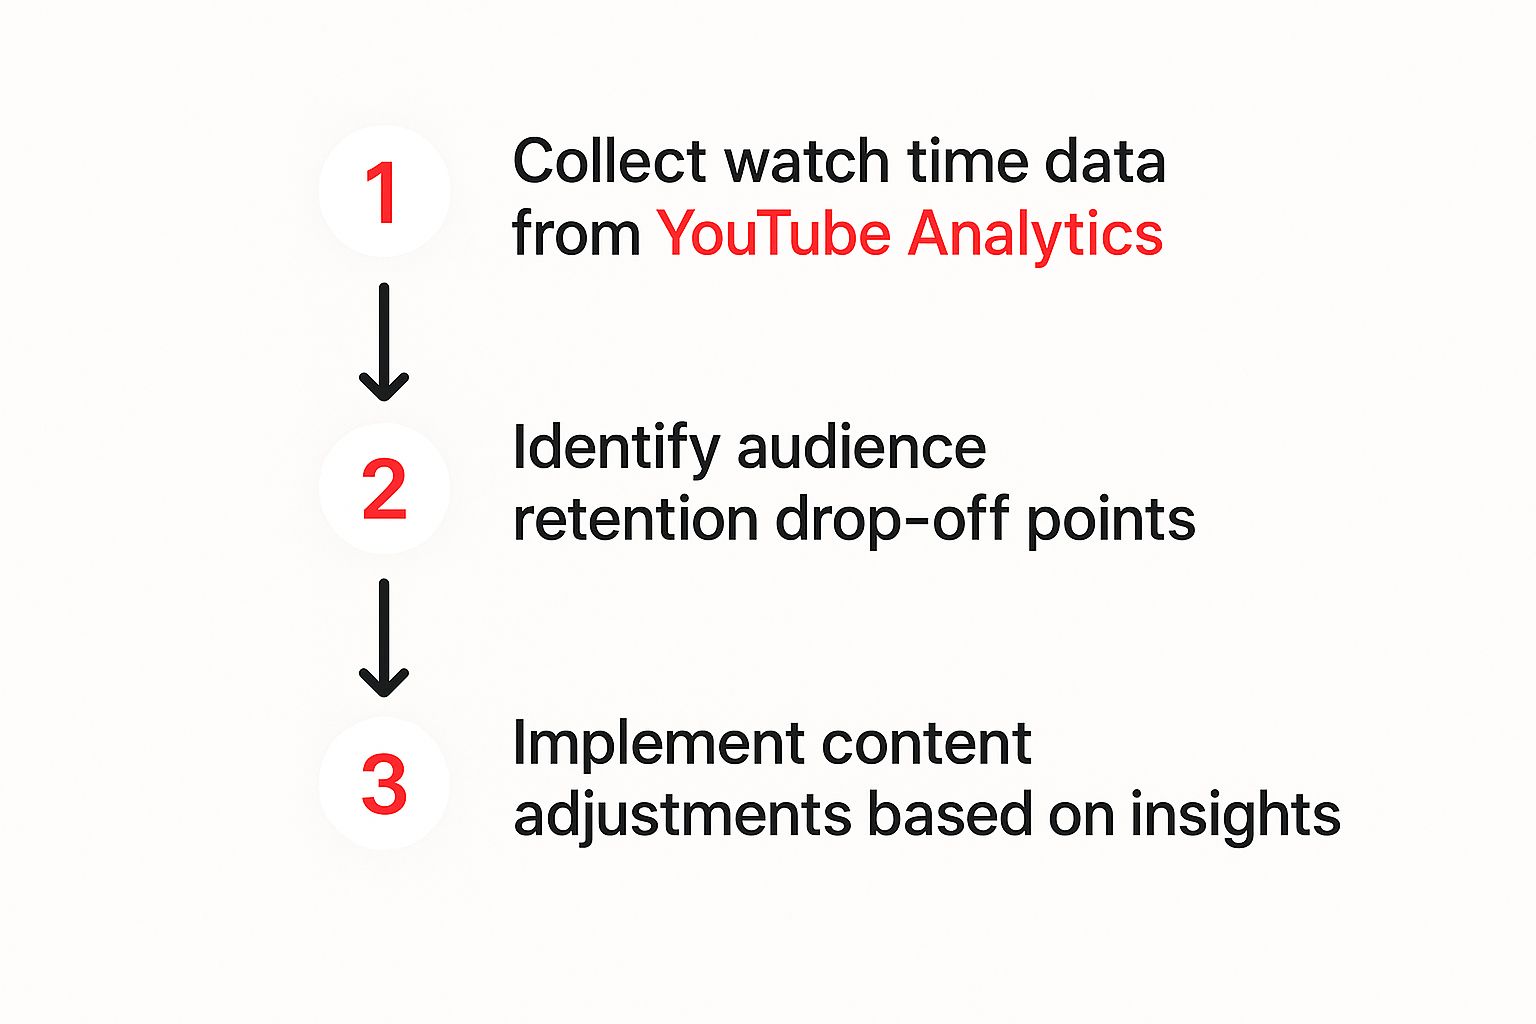
This process shows you how to systematically pull data from your youtube video analytics, spot the weak points in your content, and make targeted improvements.
The numbers behind YouTube are staggering and show just how important this is. With advertising revenue hitting $36.1 billion and the average user spending around 27 hours a month on the platform, the opportunity is just massive. This deep engagement, bolstered by over 100 million Premium and Music subscribers, makes high-quality watch time the most valuable currency you can have on YouTube.
Thought-Provoking Strategy: Don’t just obsess over your best-performing videos. Find a video that got tons of impressions but had a terrible CTR. This is your “missed opportunity” analysis. What went wrong? Was the title boring? Was the thumbnail a mess? Learning from these failures is often more valuable than just celebrating your wins.
Unlocking the Secrets Hidden in Your Audience Retention Graphs
If you want the most brutally honest feedback you’ll ever get, look no further than your audience retention graph. It’s a second-by-second truth-teller, showing you exactly what captivated your audience and what made them head for the exit. Learning to read these squiggly lines isn’t just a box-ticking exercise in youtube video analytics; it’s genuinely the key to making videos people actually want to watch.
I like to think of the retention graph as a story with four key chapters. Each one tells you something vital about your content. Once you master reading them, the way you plan, shoot, and edit your videos will never be the same.
The Make-or-Break First 30 Seconds
That first big drop you see on the graph? It’s often the steepest, and it tells you one thing: whether you delivered on the promise of your thumbnail and title. If you see a massive nosedive right away, it’s a clear sign of a mismatch between what viewers expected and what you gave them.
Your mission in those first 30 seconds is simple: reassure the viewer that they made the right click. Ditch the long, fancy logo animations and the generic “Hey guys, what’s up?” intros. Get right to the good stuff and confirm the value you’re about to deliver. A powerful, clear hook can be the difference between a viewer who bounces and one who sticks around for the whole ride.
Actionable Tip: Regularly run a “retention audit” on your last five videos. Specifically look at the 30-second mark. For the videos that tanked, ask if the intro was slow or misleading. For the ones with high retention, what did you do differently? That pattern is pure gold.
Spotting the Spikes to Replicate What Works
Seeing a spike in your retention graph—where the line actually goes up—is an amazing feeling. It means people are rewinding to watch a specific part again. Your audience is literally shouting, “Hey, this part was super valuable, hilarious, or interesting!”
Don’t just nod and move on. You need to become a detective and dissect these moments. What was happening right then?
- Was it a killer tip you dropped?
- A perfectly timed joke or a clever bit of editing?
- A complex idea you managed to explain in a simple, elegant way?
These spikes are your content’s greatest hits. They are a direct instruction from your audience on what they love. Your job is to figure out the secret sauce in that moment and find ways to sprinkle that magic into your future videos.
Of course, you can’t get a spike if no one clicks to begin with. That’s where a killer thumbnail comes in. Before you even hit publish, peek at what visuals are working for the top performers in your niche with the Thumb Scout Chrome extension.
Decoding the Dips to Eliminate Boredom
Just as spikes show you the good stuff, dips show you where you went wrong. A dip is any spot on the graph where a chunk of your audience decided they’d had enough and clicked away. These are the moments of boredom, confusion, or just bad pacing.
When you spot a dip, jump to that timestamp in your video and be honest with yourself. Did you ramble on a tangent? Did the energy just die? Was there an awkward pause or a graphic that made no sense? These are the friction points you need to smooth out. Often, you can patch these up with a simple “pattern interrupt”—a quick zoom-in, a sound effect, or even just a quick cut to a B-roll shot can re-engage a wandering mind.
Sticking the Landing: The Final Drop-Off and Your CTA
It’s totally normal to see viewership trail off as a video winds down. But a steep, sudden cliff-dive right before your end screen is a red flag. It means people are leaving before you even get to your call to action (CTA). This usually happens when your outro is too long, predictable, or just feels like an abrupt end.
Here’s a great trick: start your outro while the main content is still wrapping up. Don’t have a hard stop where you say, “Okay, that’s the end of the video!” Instead, transition smoothly into suggesting another video or asking for a subscription while you’re still delivering value. This keeps people watching until the very last second.
Taking Your Channel Strategy to the Next Level with Advanced Analytics
Alright, once you’ve gotten comfortable with the basics in your Reach and Audience tabs, it’s time to really start thinking like a strategist. This is where we shift from looking at individual video performance to seeing your channel as one big, interconnected content machine. The key to unlocking this is “Advanced Mode” in your youtube video analytics, and trust me, it’s not as scary as it sounds.
Think of Advanced Mode as your personal data playground. It’s where you can line up your videos side-by-side and see what’s truly working. For instance, you could compare your top five videos to find out which traffic sources are bringing in the most subscribers—not just views. This is the kind of insight that turns guesswork into a real, data-backed plan.
Finding Your “Tentpole” Videos
One of the most powerful things you can do for long-term growth is to pinpoint your “tentpole” content. These are the foundational videos that consistently pull in new viewers and, critically, convince them to subscribe. They’re the pillars holding up your entire channel.
Jump into Advanced Mode and filter your videos by “Subscribers Gained.” Set the time frame to 90 days or even a full year. You’ll probably see a small handful of videos responsible for the lion’s share of your new subscribers. Those are your tentpoles.
The real magic isn’t just identifying your tentpole videos; it’s digging into why they’re so successful. Do they cover a specific topic? Share a similar format? Have a certain style of title? Figuring this out gives you a repeatable formula for future hits.
Once you know what they are, your job is to build a content strategy around them. I don’t mean you should remake the exact same video. Instead, create new content that scratches the same itch for that audience. Think of it as building a “content cluster” around your winning topics. Before you hit record, give those new ideas a head start by running your thumbnail concepts through Thumb Scout to make sure they’ll grab attention.
Smart Competitor Research to Find Content Gaps
Your own youtube video analytics are a goldmine, but they only tell you what’s happening on your own turf. The other half of the story comes from understanding what’s going on in your niche. By ethically checking out what’s working for your competitors, you can uncover some massive opportunities.
This isn’t about copying—it’s just smart market research. Look at the best-performing videos from other creators in your space. What topics are resonating with their audience that you haven’t touched? Are there questions piling up in their comment sections that nobody is answering? These are content gaps just waiting for you to fill.
The Thumb Scout Chrome extension is a fantastic tool for this kind of recon. It lets you instantly see which of a competitor’s thumbnails are performing best, giving you clues about what visuals are clicking with your shared audience.
This kind of strategic thinking is essential when you remember the sheer scale of YouTube. The platform has roughly 2.7 billion monthly active users, making it the second-largest social media site in the world. With people watching over a billion hours of video every single day, you’re fighting for attention in a crowded stadium. Understanding these high-level stats, like those found in this overview of the global YouTube user base, helps put your own channel’s journey into perspective.
When you blend your channel’s data with these broader market insights, you start thinking on a whole new level. You move beyond a video-to-video mindset and begin building a powerful, sustainable engine that doesn’t just get views, but builds a loyal community. If you’re ready to go even deeper on this, be sure to check out our complete guide on how to get more views on YouTube.
Common Questions I Hear About Getting Strategic

Let’s be real—diving into your youtube video analytics can feel like you need a secret decoder ring. One minute the numbers are up, the next they’re down, and it’s easy to wonder what it all means. It’s completely normal to feel a bit lost in the data. Here are some casual, realistic answers to common questions about using your YouTube analytics for growth.
How do I compare video performance in Advanced Mode?
It’s actually pretty easy. Head to your YouTube Analytics, click on “Advanced Mode,” and you’ll see a big table of your videos. At the top, there’s a “Compare to” feature where you can select specific videos, groups, or different time periods to see their stats laid out next to each other.
What metrics should I focus on when looking for tentpole content?
Views are a good starting point, but the real treasure is in Subscribers Gained and Watch Time (hours). A video that brings in a steady stream of new subscribers is incredibly valuable. The same goes for a video that keeps people watching for a long time—that’s a strong signal to YouTube that you’re making quality content.
How far back should I look when analyzing data?
For finding those core tentpole videos, I suggest looking at the “Last 365 days” or even “Lifetime.” This gives you the big picture. For tracking more recent trends or comparing new video strategies, the “Last 90 days” is a great window because it smooths out the weird spikes or dips from a single video.
Is it okay if my channel doesn’t have a clear “tentpole” video yet?
Absolutely! That’s completely normal, especially for newer channels. If that’s you, your main job is to stay consistent and keep experimenting with different topics, formats, and styles. Over time, the data will show you what your audience loves, and your channel’s pillars will naturally start to emerge.
What’s the best way to improve my YouTube search traffic?
Focus on solving specific problems for your audience. Use keyword research tools to see what people are actively searching for, then create detailed, high-quality videos that provide the best answer. Make sure your title, description, and tags all clearly reflect that topic.
How can I find content gaps by analyzing my competitors?
Check their most popular videos and read the comments. Are viewers asking follow-up questions? Are they mentioning a related topic they wish the creator would cover? Those comments are a goldmine for content ideas that you know people are already looking for. And don’t forget to analyze their visuals with the Thumb Scout Chrome extension.